Electromagnetic spectrum
Introduction
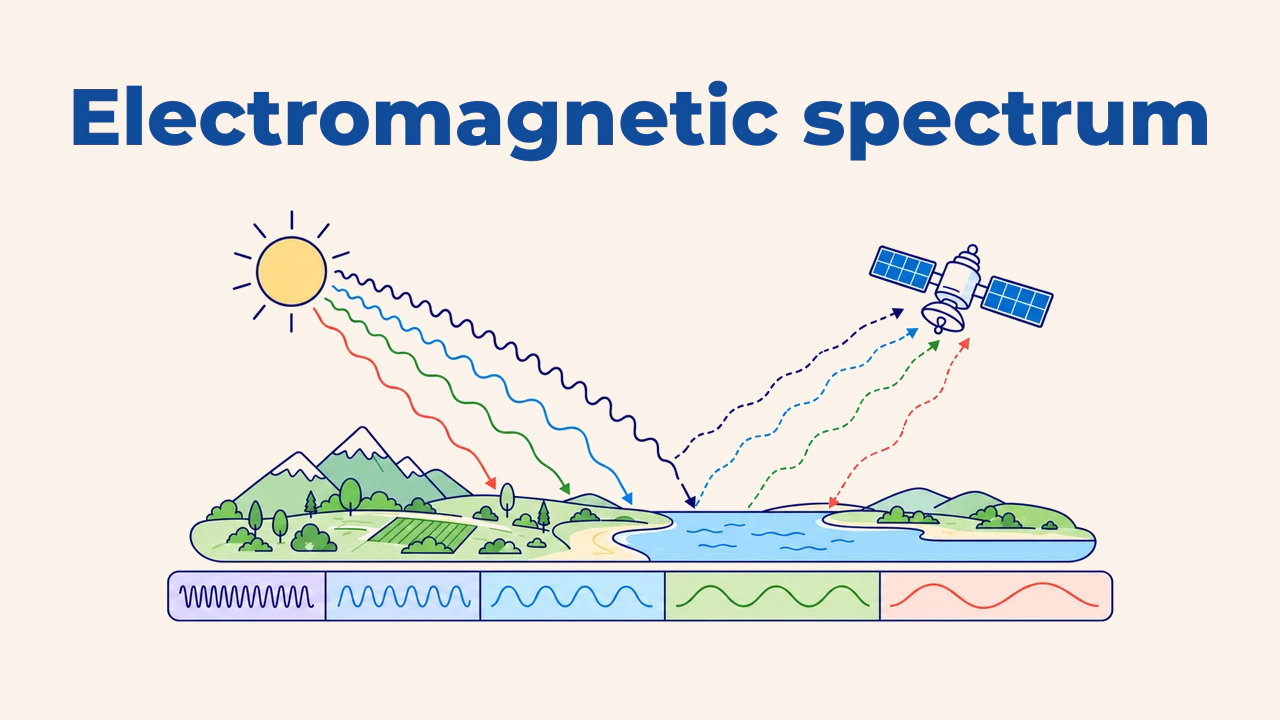
The electromagnetic spectrum is the full range of electromagnetic radiation ordered by wavelength or frequency. Visible light perceived by human eyes represents only a tiny slice of this continuum. Ultraviolet, infrared, and microwave radiation remain invisible to people, yet sensors measure them accurately.
Remote sensing detects and records this radiation. The chosen spectral region determines what features become distinguishable: plant vigor, water boundaries, surface temperature, or ground terrain beneath cloud cover separate distinctly across different wavelengths.
Wavelength and energy
Electromagnetic waves travel at the speed of light. Wavelength (λ) and frequency (ν) share an inverse relationship: c = λ · ν. As wavelengths shorten, frequency and individual photon energy increase. Consequently, an ultraviolet photon carries more energy than an infrared photon.
In optical remote sensing, wavelength is typically measured in micrometers (µm) or nanometers (nm); 1 µm equals 1,000 nm. Radar systems operate in centimeters. Mixing up units leads to misinterpreting band specifications, so analysts always verify units recorded in sensor metadata.
Core spectral regions
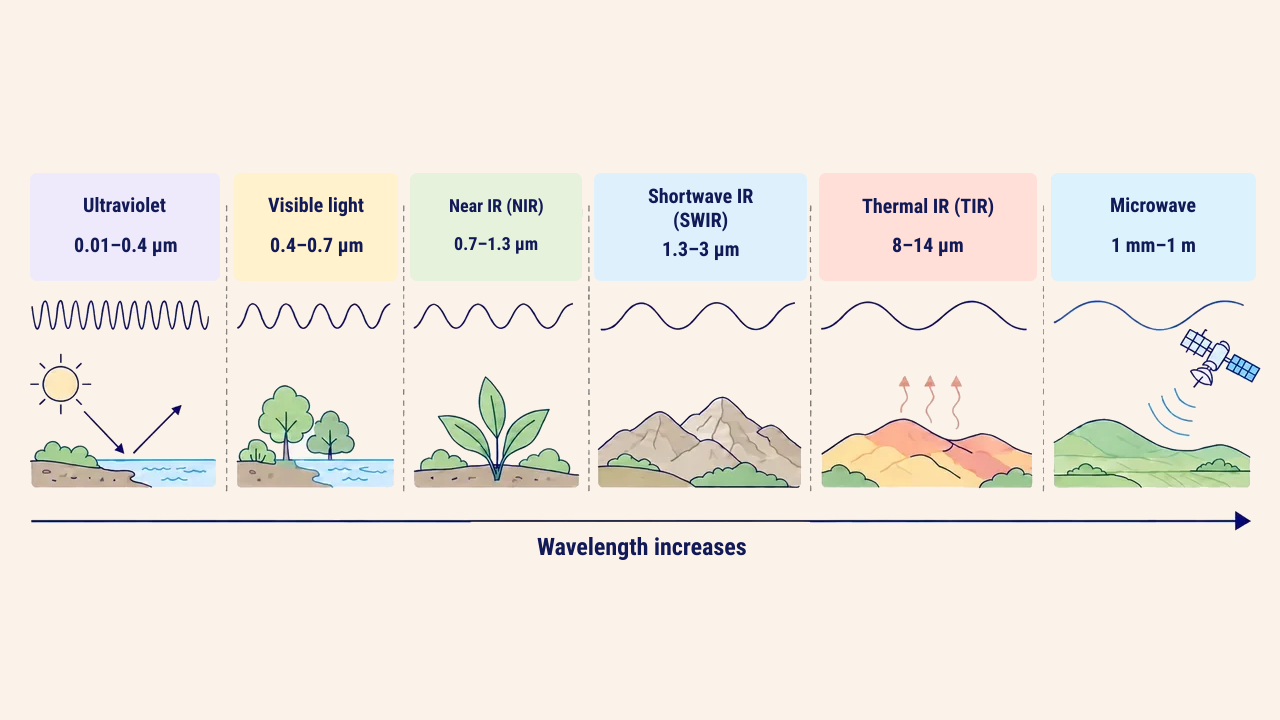
In practical remote sensing, the spectrum is divided into several operational intervals. Exact boundaries vary slightly between scientific sources, but standard values include:
| Region | Wavelength | What it reveals |
|---|---|---|
| Ultraviolet | 0.01–0.4 µm | Heavily absorbed by atmosphere, rarely used in Earth observation |
| Visible (blue, green, red) | 0.4–0.7 µm | Color, water turbidity, bare soil, and built infrastructure |
| Near-infrared (NIR) | 0.7–1.3 µm | Vegetation biomass and plant health |
| Shortwave infrared (SWIR) | 1.3–3 µm | Moisture content, mineral types, burn scars |
| Thermal infrared (TIR), primary window | 8–14 µm | Land surface temperature, urban heat islands |
| Microwave | 1 mm–1 m | Radar: penetrates cloud cover, reveals surface roughness |
The NASA guide to the electromagnetic spectrum explains the physical properties and observation uses of each spectral region in depth.
Atmospheric windows
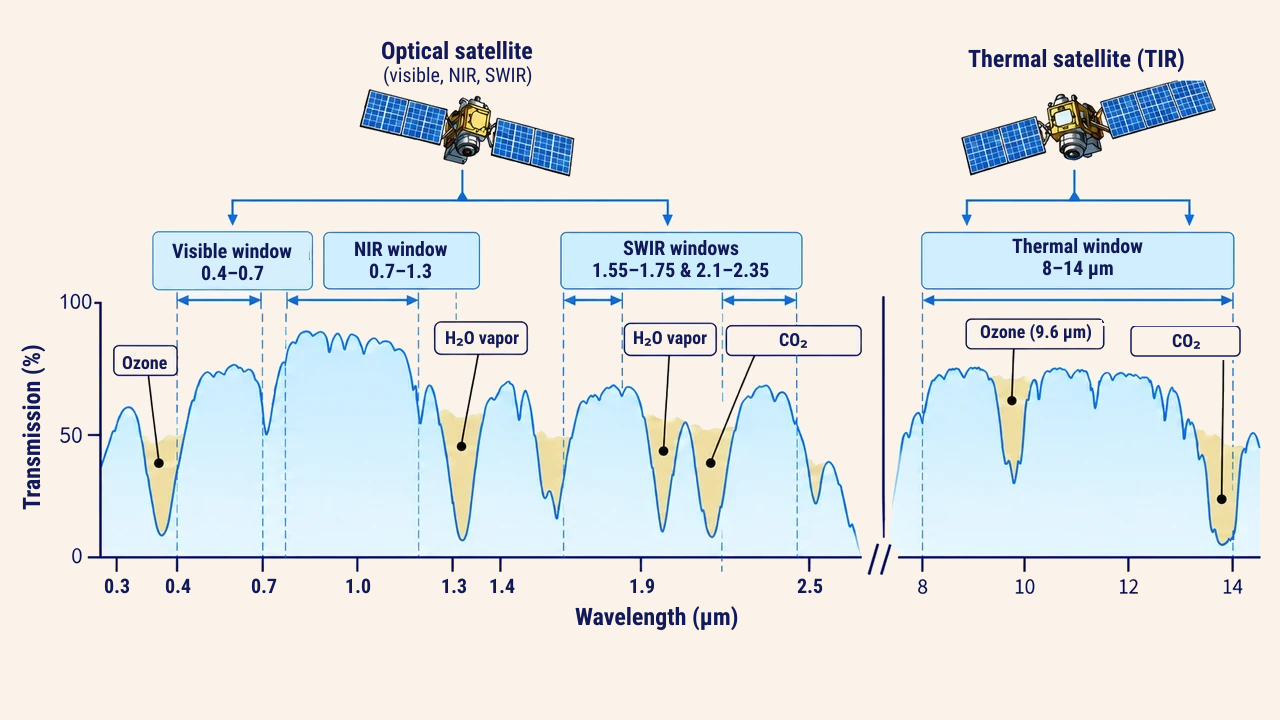
In optical sensing based on reflected sunlight, energy passes through the atmosphere twice: first travelling from the Sun to the Earth's surface, and then reflecting into the orbiting sensor. Thermal sensors detect radiant energy emitted directly by Earth, while radar systems emit pulses and measure returning backscatter. Atmospheric ozone absorbs most solar ultraviolet rays, whereas water vapor and carbon dioxide block specific infrared bands. Spectral intervals where radiation passes with minimal loss are termed atmospheric windows.
Optical and thermal sensor channels are designed within these windows. Thermal sensors positioned within the 8–14 µm window represent a prime example. Conversely, specific bands intentionally target absorption regions: Landsat 8/9 Band 9 (1.36–1.38 µm) and Sentinel-2 Band 10 (centered at 1,375 nm) cannot see ground features because of lower-atmosphere water vapor, allowing them to isolate high-altitude cirrus clouds. Sentinel-2 Band 9 (945 nm) measures water vapor to support atmospheric correction. In the blue spectrum, Rayleigh scattering by air molecules is intense, giving raw blue imagery a hazy appearance that requires atmospheric correction. Most microwave radar bands penetrate clouds and haze with minimal loss, though intense precipitation can attenuate shorter radar wavelengths.
Sensor bands in the spectrum
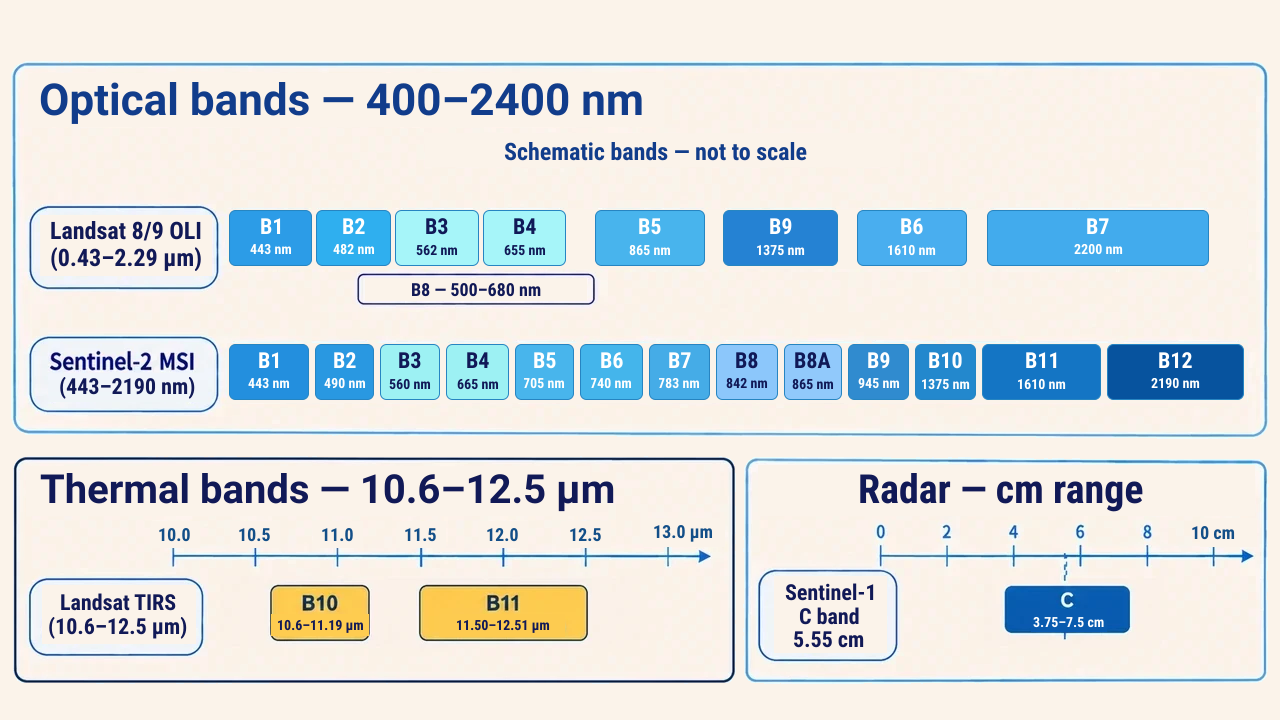
Optical sensors record radiation across discrete spectral bands rather than across an unbroken continuum. Each band registers energy across a defined wavelength range, generating digital measurement values for every pixel. According to the USGS, OLI sensors on Landsat 8 and 9 collect nine spectral bands spanning 0.43–2.29 µm, while TIRS sensors feature two thermal channels between 10.6 and 12.5 µm. According to ESA, the Sentinel-2 MSI instrument captures 13 spectral bands with central wavelengths from 443 nm up to 2,190 nm.
Band numbers are not interchangeable across missions. On Landsat 8, Band 4 captures red light, whereas on Landsat 7, Band 4 designated near-infrared (0.77–0.90 µm). Analysts must always evaluate band wavelength definitions rather than relying on sequential numbers.
Practical interpretation
Chlorophyll inside healthy leaves absorbs blue and red wavelengths, while the internal cell structure reflects near-infrared energy intensely. Consequently, active vegetation appears dark in red bands and bright in NIR imagery. Clear, deep water absorbs almost all NIR and SWIR radiation, appearing distinctly dark. However, suspended sediment alters this response; a USGS study demonstrated that optical signals from turbid rivers reflect a combination of water NIR absorption and light scattering from suspended sediments. When delineating river channels such as the Syr Darya or Amu Darya, comparing visible, NIR, and SWIR bands helps identify the most effective band based on prevailing turbidity.
Specialists match spectral bands to analytical goals: red and NIR for vegetation indices, NIR and SWIR for fire perimeters, thermal infrared for urban heat islands, and microwave radar during overcast weather. Before processing, analysts confirm spectral bandwidth, spatial resolution, and processing levels. In optical analysis, surface reflectance is essential, while thermal analysis requires distinguishing between at-sensor radiance, brightness temperature, and true land surface temperature.
Conclusion
The electromagnetic spectrum governs what Earth features can be captured through remote sensing. Each spectral region interacts uniquely with surface materials, while the atmosphere determines which windows remain open for orbital observation.
Trustworthy spatial insights rely on matching physical wavelengths to analytical goals, accounting for atmospheric effects, and selecting sensor bands calibrated to target materials.