Geographic data types: vector and raster
Introduction
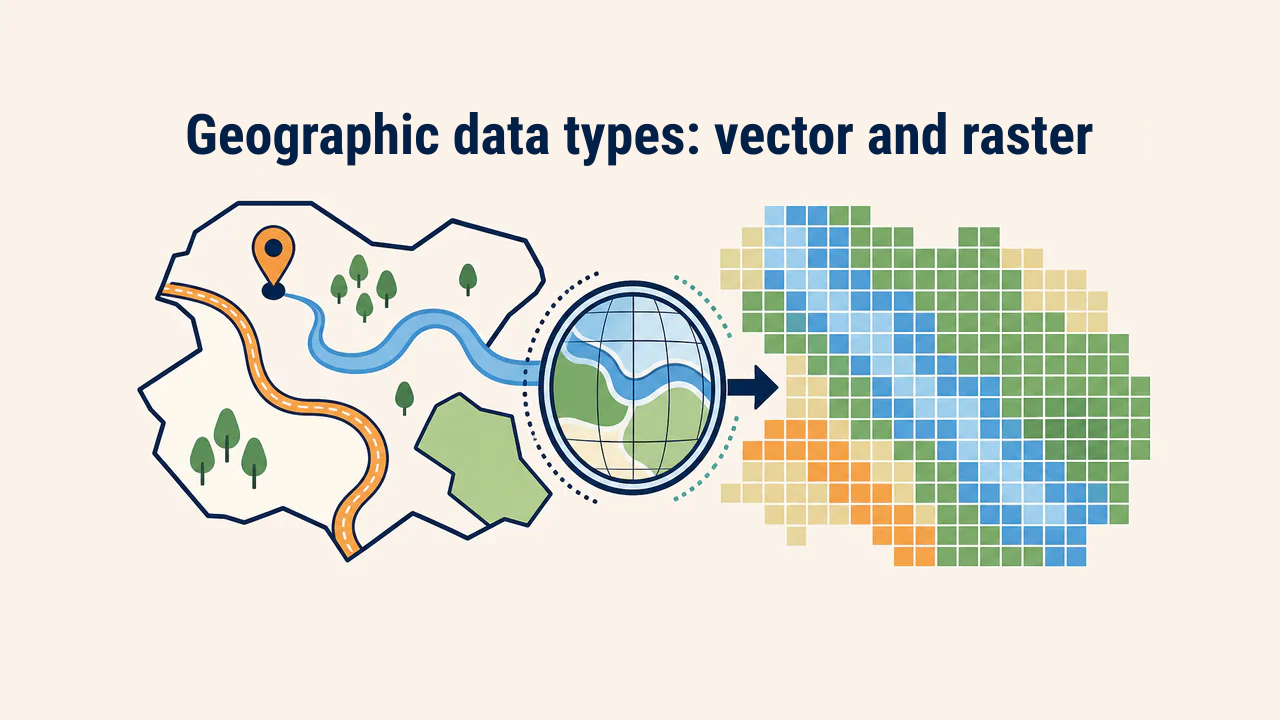
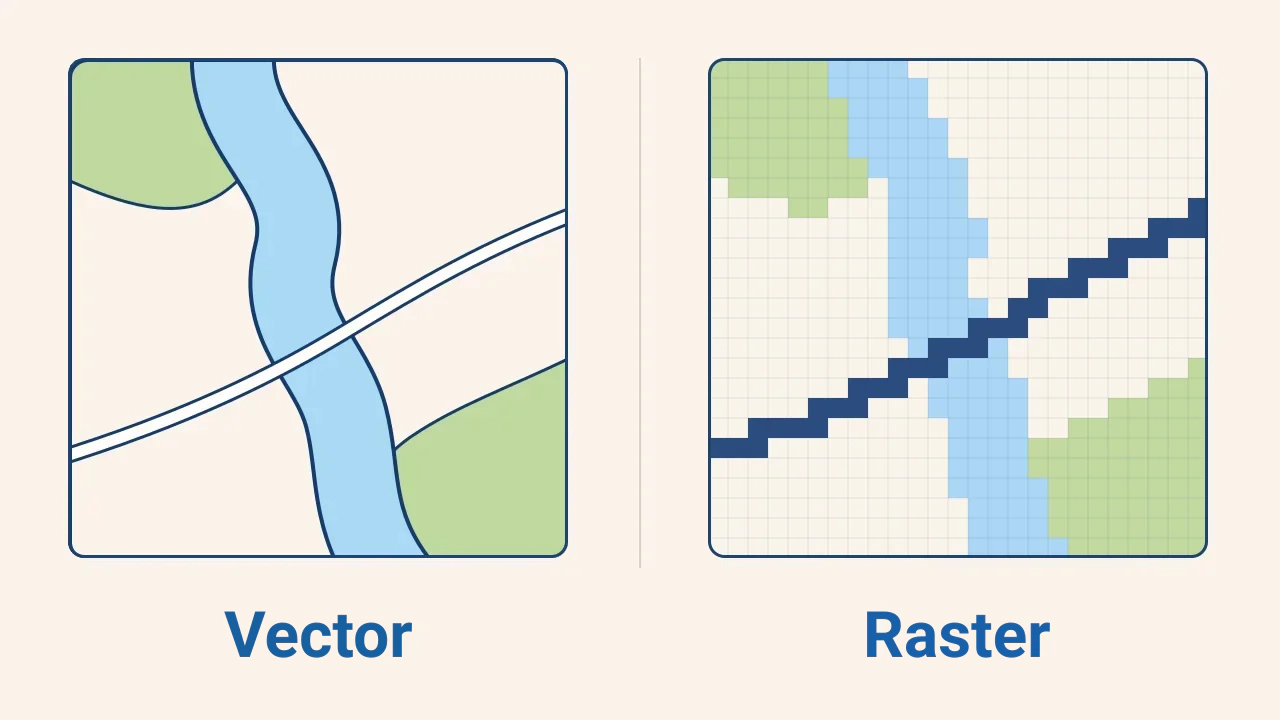
Geospatial data represents the location and attributes of features, events, or processes on Earth. In GIS, it is stored mainly in two models: vector and raster. The vector model represents distinct features using coordinates, while the raster model portrays an area through a grid of cells.
A data model is more than a file format. It dictates how features are portrayed, which analytical operations can run, detail level, and storage requirements. For example, a highway is best represented as a linear vector, whereas continuous phenomena like surface temperature are depicted naturally as rasters.
Vector model: discrete features
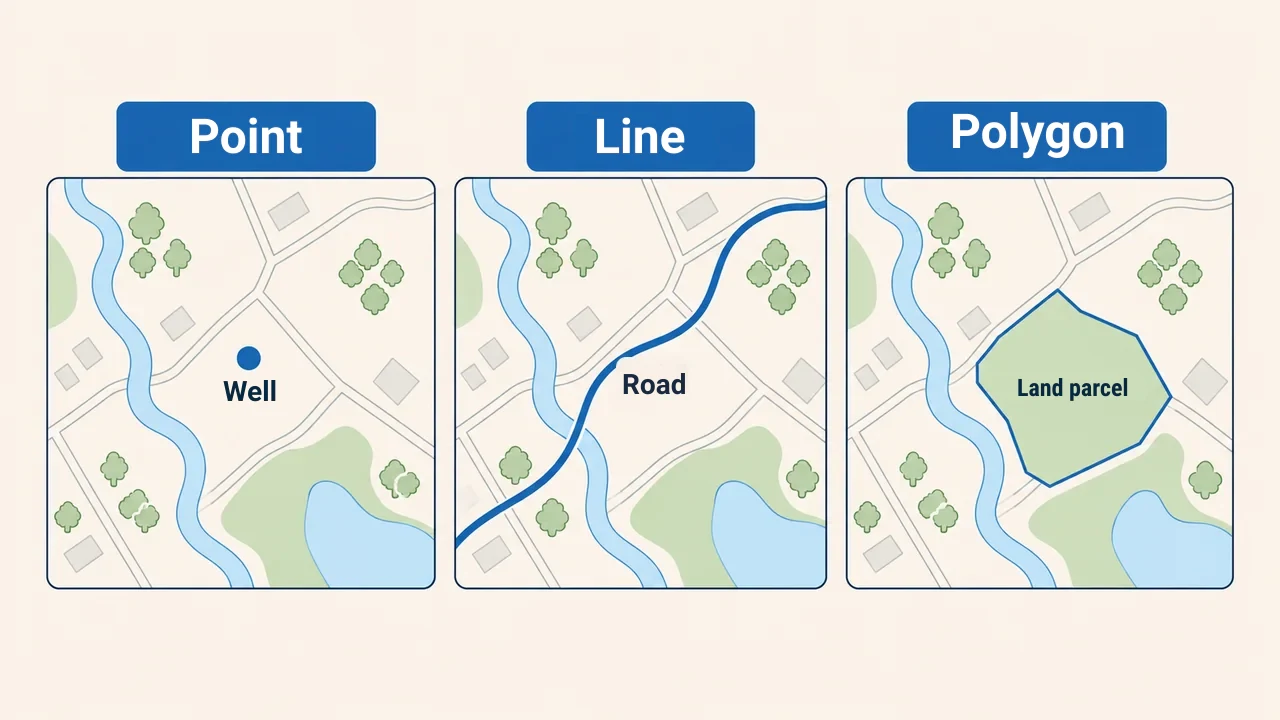
In the vector model, a geographic feature is constructed from coordinate sequences. Three primary geometry types exist:
- point — features without surface area at scale (wells, trees, bus stops);
- line — linear features with length (roads, rivers, utility lines);
- polygon — closed boundaries defining area (parcels, lakes, districts).
Each geometry links to an attribute table record. Users can select features on a map, inspect attributes, filter values, and edit geometry. Vector data excels for features with definite borders, cadastres, and networks. However, complex borders increase file size, and dividing continuous surfaces into polygons yields artificial boundaries.
Raster model: continuous grid surfaces
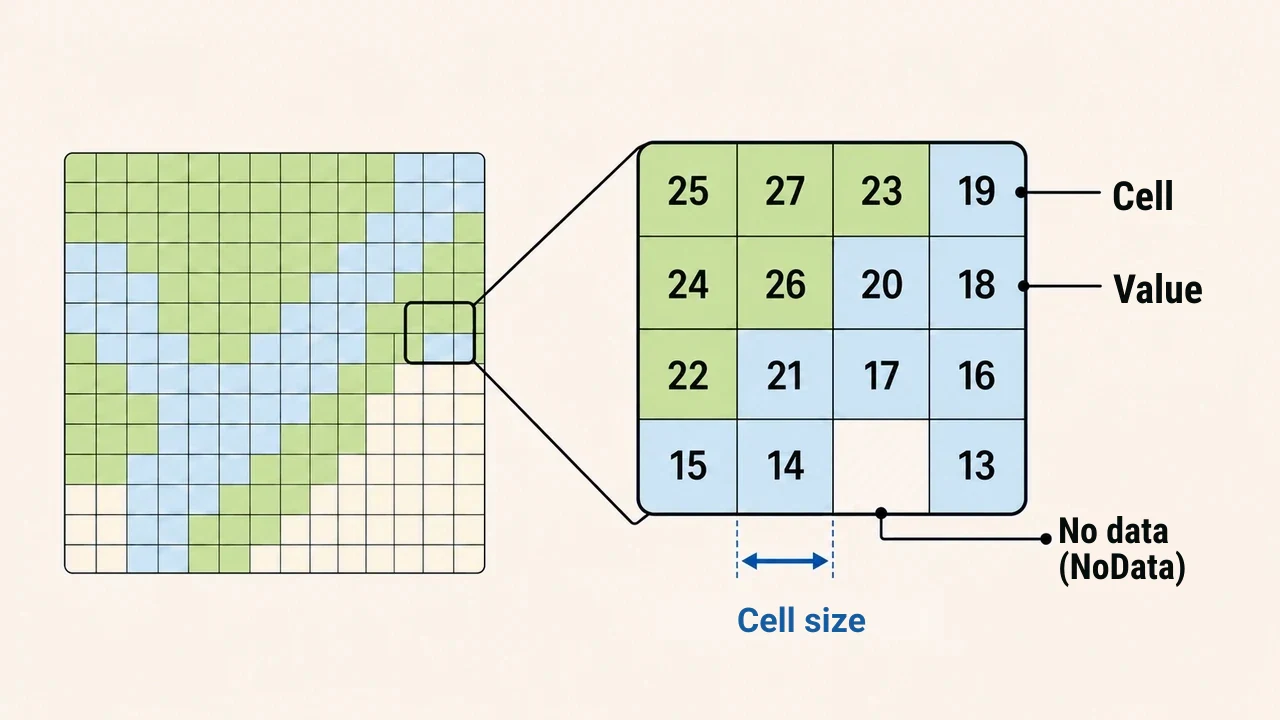
In the raster model, an area is partitioned into rows and columns of uniform cells. Each cell holds a single value: elevation, temperature, land cover, or brightness. Satellite scenes may contain multiple spectral bands, while digital elevation models store terrain height per cell.
A key raster parameter is cell size, representing ground distance covered by a pixel. Smaller cells resolve finer detail, but increase file size and processing load. Unobserved cells receive a NoData value. Before overlay analysis, cell size, grid alignment, coordinate reference systems, and NoData definitions must be checked to prevent calculation errors.
Key differences between vector and raster
| Criterion | Vector | Raster |
|---|---|---|
| Structure | Coordinate-based points, lines, and polygons | Regular grid of value-bearing cells |
| Best suited for | Discrete features with well-defined borders | Continuous surfaces and satellite imagery |
| Detail level | Dependent on geometry vertices and scale | Dependent on cell size (resolution) |
| Core analysis | Network routing, topology, feature querying | Surface modeling, spectral analysis, map algebra |
| Main hazard | Geometry and topological errors | Inappropriate cell size or mishandled NoData |
The same phenomenon can often be modeled in either format. For instance, a river can be delineated as a line or polygon in vector format, or as contiguous water cells on satellite imagery. While conversion between vector and raster is common, doing so can smooth discrete edges or sacrifice subtle source detail.
How to select the right model?
Selection is guided by task objectives, not format preferences. Before starting, assess:
- Is the feature discrete with clear borders or a continuous surface?
- Does the workflow require feature queries or cell-based calculations?
- What level of detail, accuracy, and scale is needed?
- What is the source quality, volume, and update frequency?
Vector is chosen for legal parcel boundaries, while raster suits classifying land cover from satellite imagery. Real projects often use both: rasters determine conditions, and results are summarized by vector zones. Specialists assess coordinate systems, scale, resolution, topology, and metadata rather than file extensions.
Conclusion
Vectors portray discrete objects via points, lines, and polygons, while rasters represent landscapes through value-bearing cells. Neither holds a universal advantage: the proper choice depends on physical phenomenon, analysis method, and required detail. Reliable GIS results require verifying coordinate systems, geometry, resolution, and data quality alongside model selection.