The concept of geographic layers
Introduction
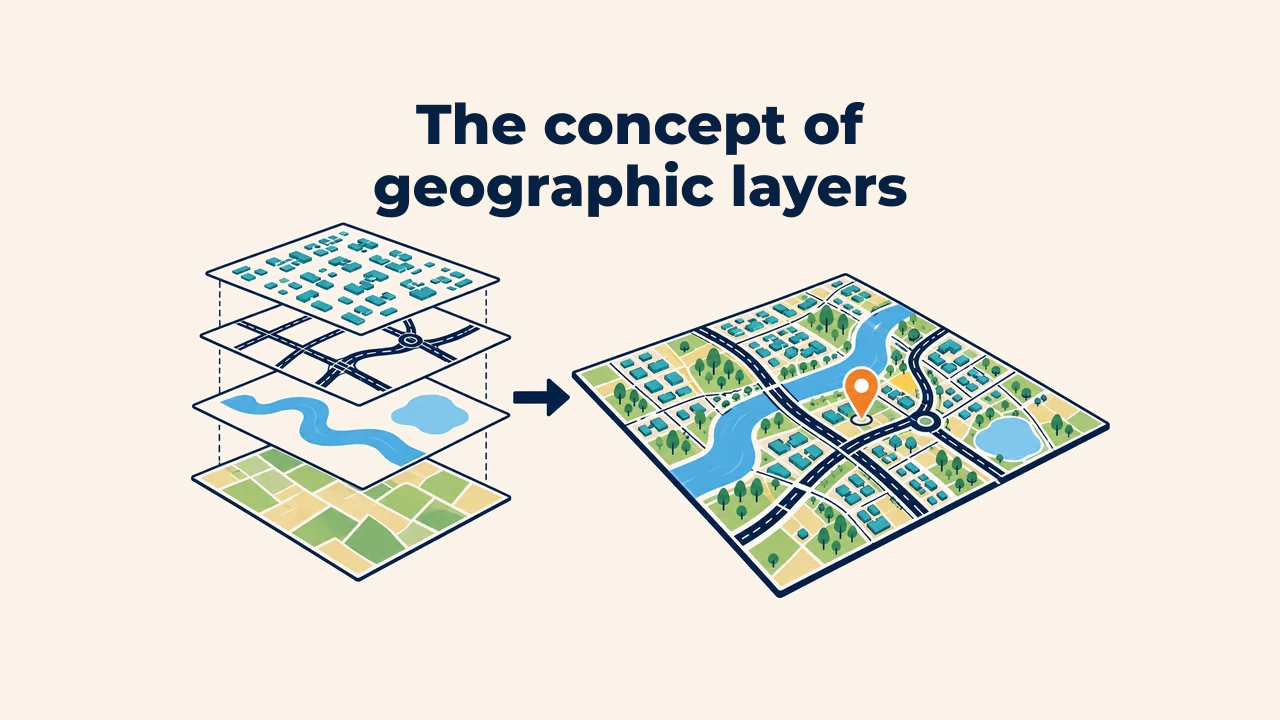
A geographic layer is a spatial dataset organizing homogeneous features or continuous phenomena for independent management on a map. Roads, buildings, rivers, administrative borders, and elevation models can represent the same territory, yet they reside in separate layers due to differing structures and applications.
Layers maintain order in a GIS project: each data type can be displayed, edited, filtered, and analyzed independently. A finished map is the purposeful composition of these organized layers.
How does a layer work?
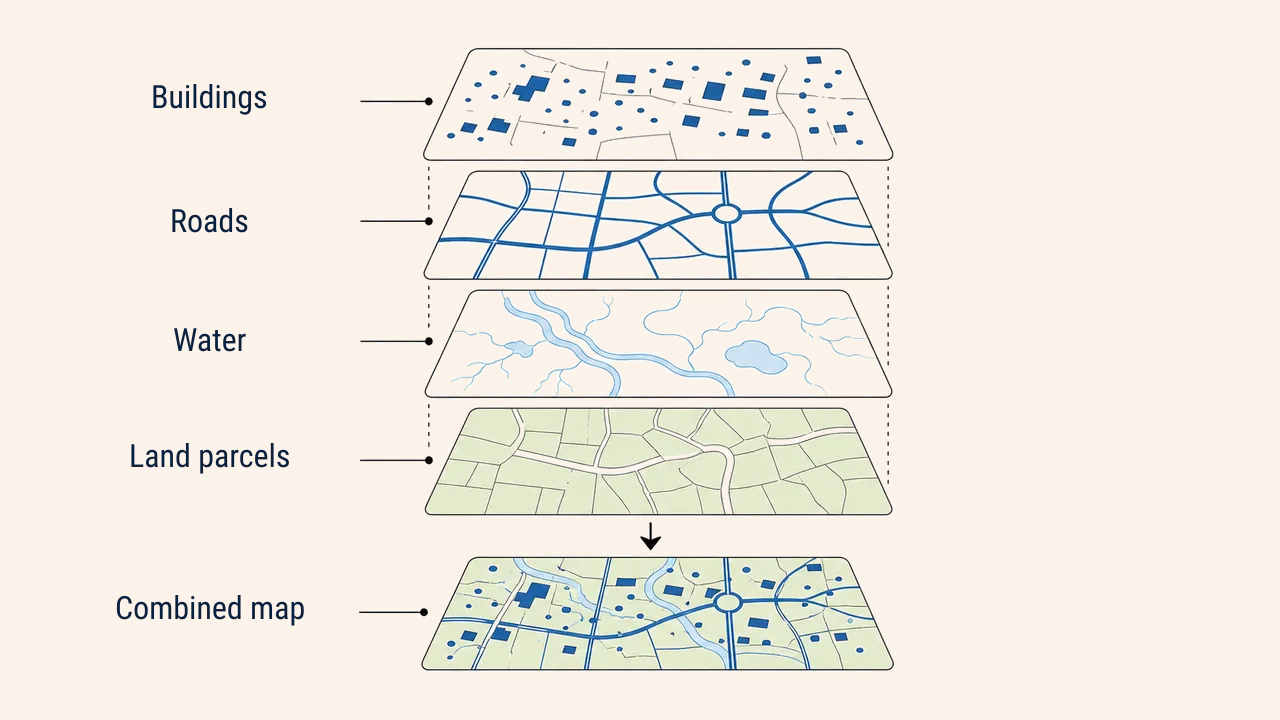
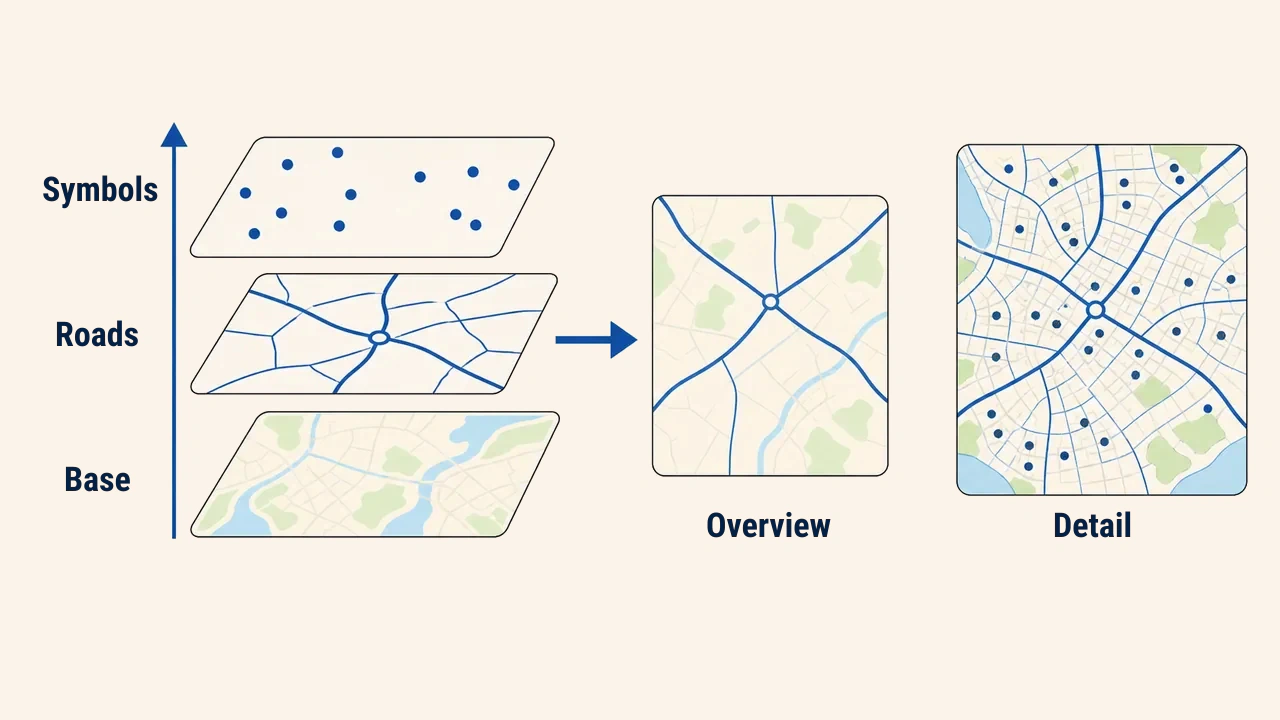
A layer can be visualized as a transparent overlay sheet. One sheet displays roads, another water bodies, and a third settlements. Aligning these sheets across a shared territory reveals spatial relationships between features. In digital GIS, layers are similarly stacked in a shared coordinate space.
Each layer typically carries one theme and geometry type. For instance, wells are modeled as points, roads as lines, and parcels as polygons. Orthophotos and elevation models are raster layers of cells. Clean thematic separation simplifies updates and clarifies analytical findings.
Geometry, attributes, and symbology
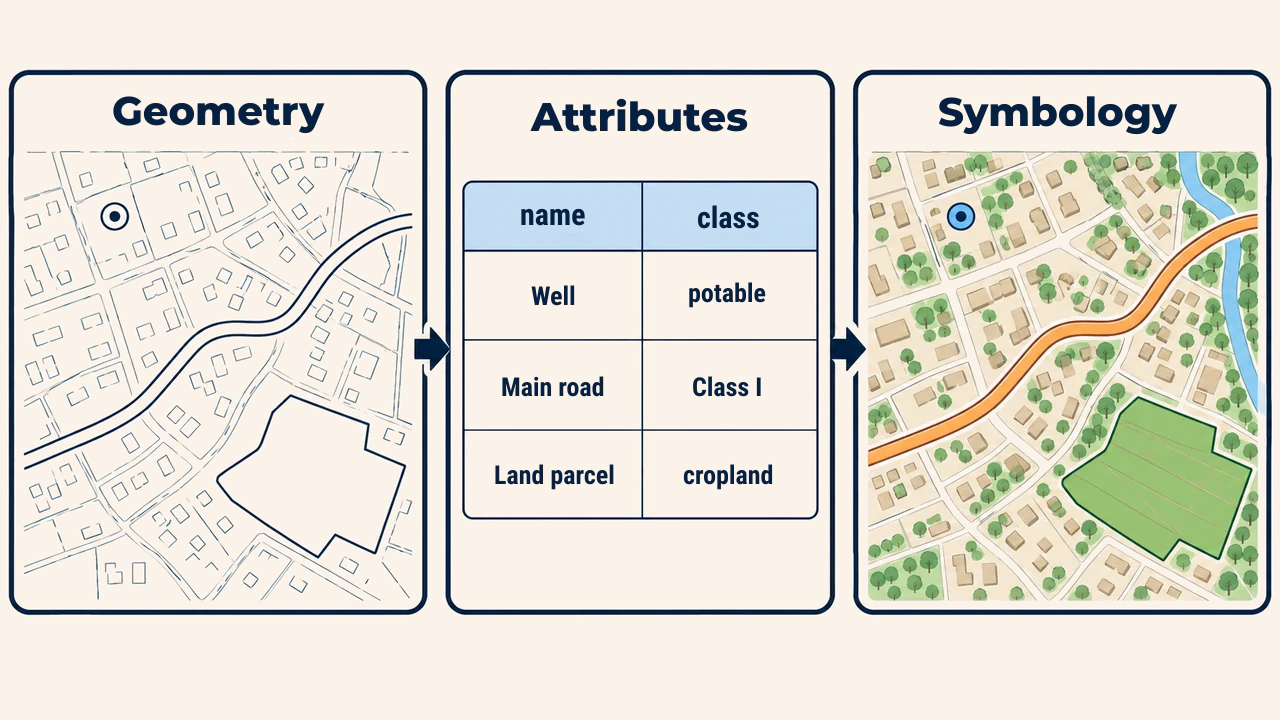
A vector feature is defined by three interconnected parts. Geometry stores its spatial location and shape. Attributes store descriptive values like name, category, length, or status in a table. Symbology dictates visual rendering: colors, line weights, fills, and symbols.
Changing symbology leaves source geometry and attributes untouched. For example, rendering roads with varying widths based on functional class does not alter underlying lines; it simply applies cartographic rules to existing attribute fields. Understanding this distinction prevents confusing visual styling with data content.
Drawing order and visibility
Layer hierarchy in the table of contents governs map display. Higher layers can obscure lower ones. Typically, base rasters or background polygons sit at the bottom, roads and boundaries in the middle, and point symbols and labels on top. Transparency and stroke weights also regulate visual clarity.
Visibility depends on map scale. Displaying local streets at national scale clutters the screen and degrades rendering performance. Setting scale ranges ensures detailed layers appear only when zoomed in. This supports generalization — simplifying and selecting features by scale — to control information density.
Collaborative spatial analysis
The primary value of layers lies in analyzing their geographic relationships. For example, combining school points, road lines, and residential polygons highlights underserved neighborhoods. This involves spatial querying and overlay analysis rather than simple visual inspection.
Before running analyses, verify each layer's coordinate reference system, positional accuracy, vintage, and geographic extent. Visual alignment does not guarantee temporal compatibility. Overlaying newly digitized roads onto five-year-old population counts may misrepresent current conditions.
Practical workflow
When adding layers to a project, follow this sequence:
- identify layer source, vintage, name, and operational purpose;
- check geometry or raster type and attribute fields;
- verify coordinate systems and spatial alignment with project data;
- assign clear names and logical group folders in the layer tree;
- set drawing order, symbology, and scale-dependent visibility thresholds;
- filter required features for analysis and save outputs into separate layers.
Keep source data unmodified, giving derived layers explicit names (roads_source, roads_cleaned, schools_500m_buffer). This convention simplifies audits and project handoffs.
Errors and quality assurance
A frequent error is mixing unrelated themes into a single layer, complicating attribute tables and query logic. Another pitfall is using vague names like new, latest, or final2, which makes identifying authoritative sources difficult later.
If a layer does not appear, check its visibility toggle, scale thresholds, active definition queries, symbology opacity, coordinate system, and whether an opaque layer sits above it. Quality control also validates feature counts, extent coverage, null attributes, and geometry errors.
Conclusion
A geographic layer is the foundational unit for thematic organization and data management in GIS. Geometry dictates location, attributes provide content, and symbology controls visual expression. Systematic naming, proper drawing hierarchy, scale management, and spatial and temporal verification ensure reliable maps and analytical conclusions.