Spectral bands and spectral signature
Introduction
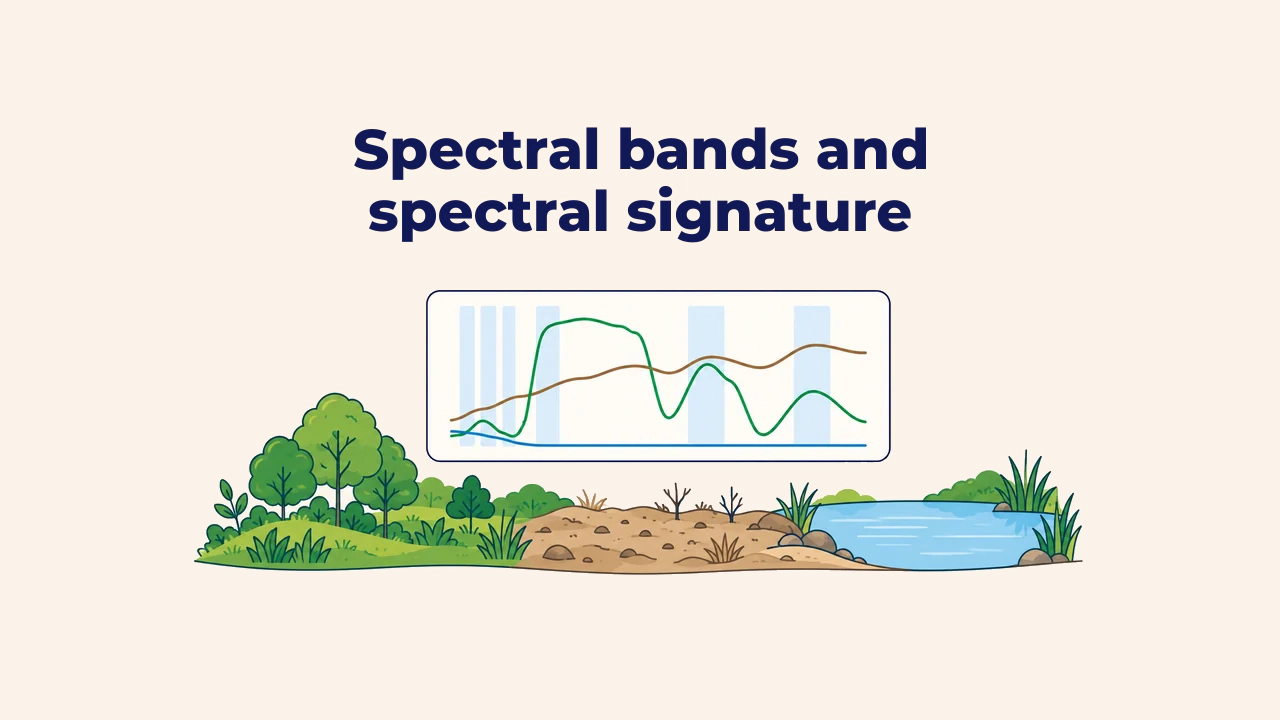
A spectral signature is a curve showing how much radiant energy a material reflects across different wavelengths of electromagnetic radiation. Vegetation, soil, and water absorb and reflect identical incoming solar illumination differently. These distinct physical responses enable satellite sensors to differentiate and classify surface features.
A signature is a continuous profile across the spectrum rather than an isolated point value. Sensors record this profile through discrete spectral bands. Where these bands fall along the curve determines how effectively analysts can distinguish materials.
Reflectance and spectral signature
Reflectance is the ratio of reflected energy to total incident radiation on a surface, typically expressed from 0 to 1 or as a percentage. On a spectral signature plot, the horizontal axis shows wavelength, while the vertical axis shows reflectance.
Chemical composition and cellular structure create characteristic peaks and valleys along the curve. Valleys indicate absorption bands, while peaks indicate regions of high reflectance. The USGS Spectral Library compiles thousands of laboratory-measured spectral signatures for minerals, soils, and vegetation types.
Three primary spectral signatures
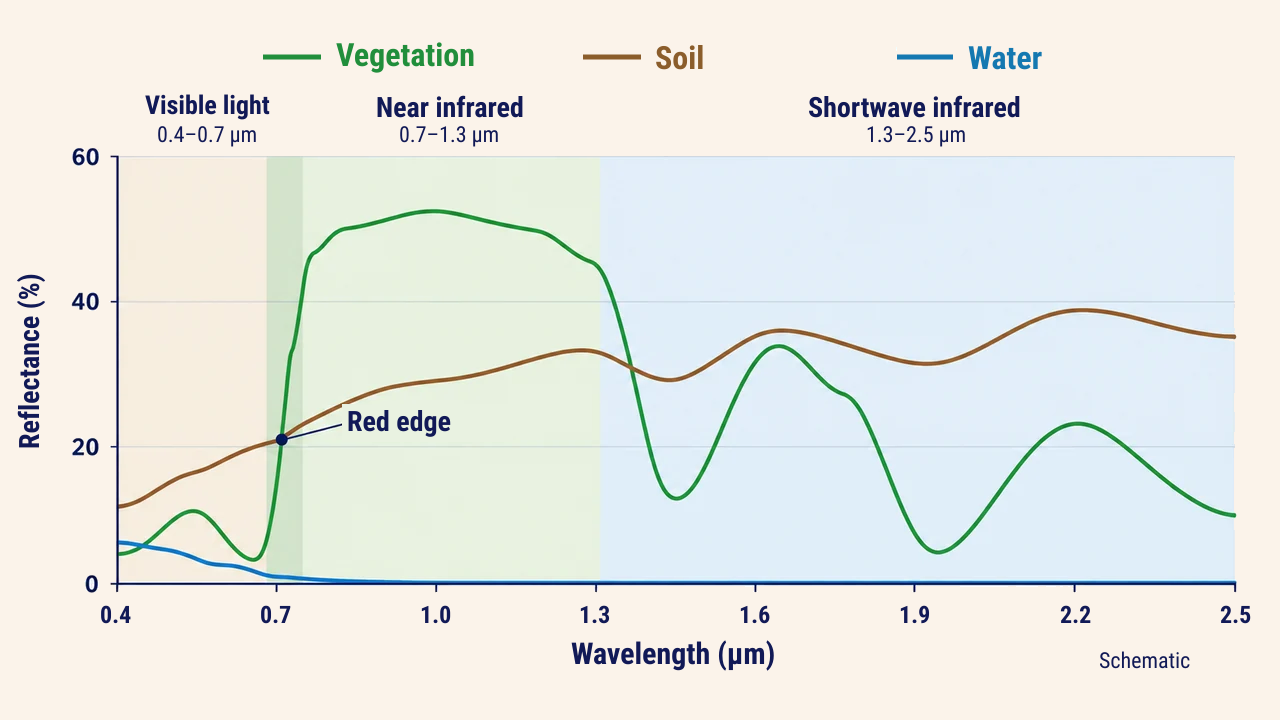
Healthy vegetation exhibits low reflectance in blue and red wavelengths due to chlorophyll absorption, with a slight peak in green. Around 0.68–0.75 µm, the curve climbs sharply—a distinct transition known as the red edge. In the near-infrared (NIR), internal leaf mesophyll cells reflect energy strongly, while water inside leaves creates absorption troughs near 1.45 and 1.94 µm.
Dry soil signatures increase steadily from visible to shortwave infrared wavelengths. Moisture and organic matter lower reflectance across the spectrum, making wet soils appear darker than dry soils.
Clear water reflects weakly in visible wavelengths and absorbs nearly all infrared radiation. In turbid water, suspended sediments increase reflectance across visible and near-infrared bands.
How sensor bands record signatures
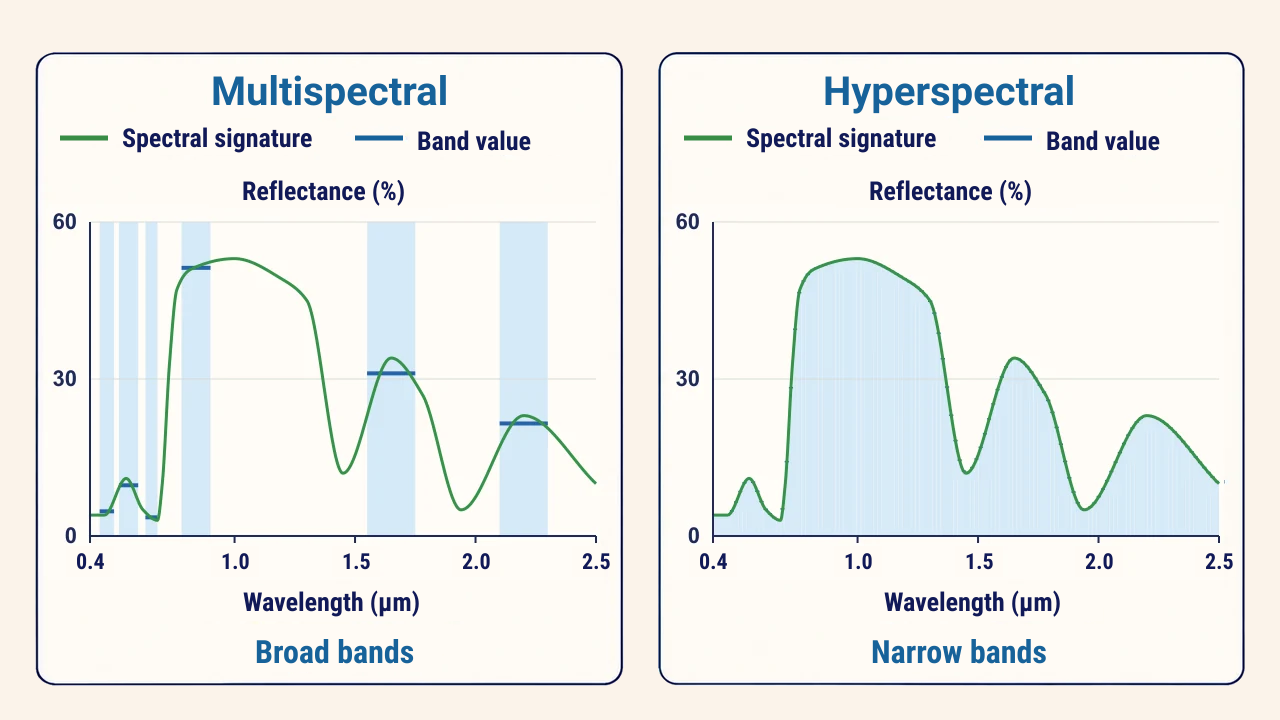
Multispectral sensors sample spectral curves using relatively broad bands. Each band averages reflectance within its bandwidth, meaning narrow absorption features can blend into adjacent wavelengths. By contrast, hyperspectral sensors record hundreds of narrow, contiguous bands, mapping the signature as an almost unbroken curve.
Sentinel-2 is optimized for vegetation: according to ESA, it features dedicated red-edge bands centered near 704, 740, and 783 nm. These bands detect minor shifts in chlorophyll concentration and plant stress far earlier than standard red and near-infrared combinations.
Vegetation index: NDVI
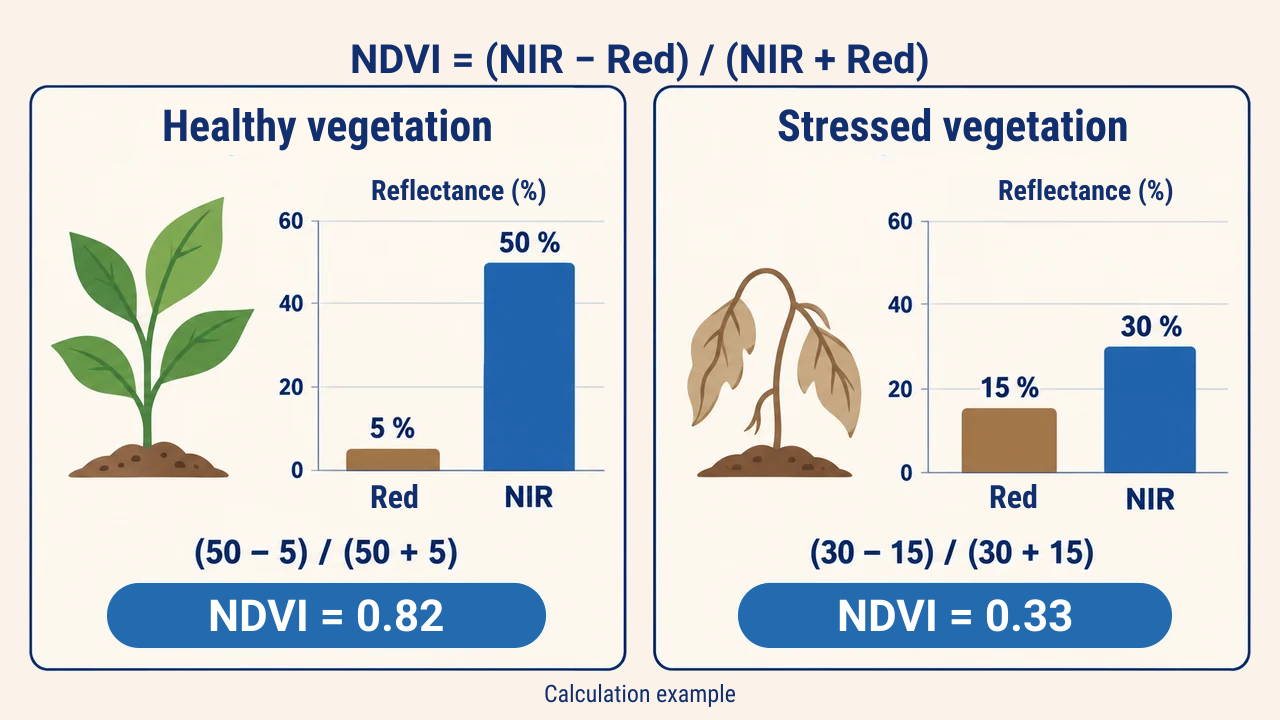
Combining two bands provides a more stable metric than evaluating single-band values alone. The most widespread vegetation metric is the Normalized Difference Vegetation Index (NDVI):
NDVI = (NIR − Red) / (NIR + Red)
Values range from −1 to +1. According to NASA, values under 0.1 correspond to barren rock, sand, or snow; 0.2–0.3 indicates shrubs and grasslands; and 0.6–0.8 represents dense closed canopies and active crops. Deep water yields negative values.
For instance, cotton fields in the Fergana Valley exhibit high NDVI during peak vegetative growth in August, dropping sharply after defoliation and harvest. Within a single parcel, patches of low NDVI point to water stress, soil salinity, or poor seedling emergence, which field scouting subsequently verifies.
Interpretation constraints
Signatures are not static. Plant phenology evolves over the season, rain darkens topsoil, and atmospheric haze distorts radiance. Therefore, comparative analyses require imagery from matching seasons and surface reflectance products that correct for atmosphere.
Individual pixels often encompass multiple surface materials. A mixed pixel signature represents an area-weighted average that resembles no single pure material. Different materials can also yield similar signatures: fresh asphalt and shadow-covered water appear similar in visible bands. In such cases, thermal data, temporal series, or field surveys resolve ambiguities.
Conclusion
A spectral signature describes reflectance across wavelengths: vegetation rises steeply at the red edge, dry soil increases gradually, and clear water absorbs almost all infrared energy. Sensor bands sample selected points along this curve.
Reliable interpretation relies on knowing band placements, computing indices like NDVI accurately, and accounting for phenological shifts, atmospheric interference, and mixed-pixel effects.