Satellites and sensors
Introduction
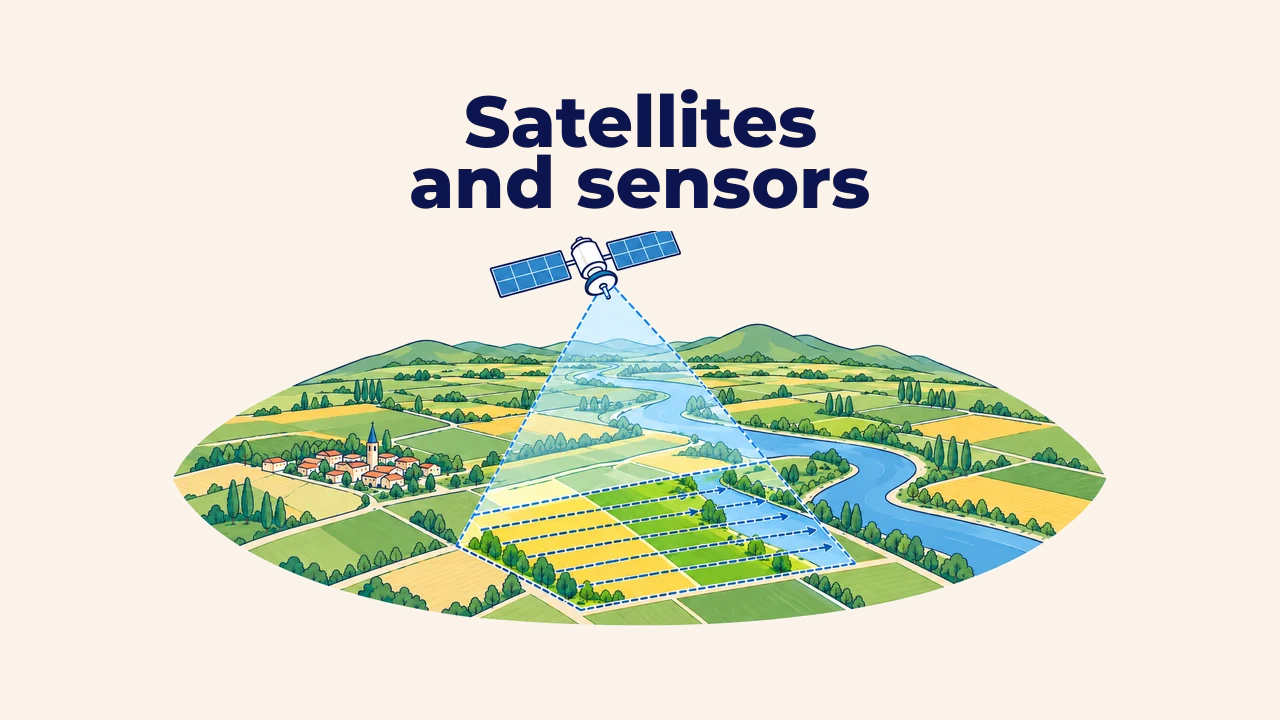
A remote sensing system comprises three interconnected components: the platform, which carries the instrument into space, the air, or the field; the sensor, which detects and records electromagnetic radiation; and the imagery, which represents the calibrated, processed output of those measurements.
The same geographic area appears differently across satellite systems. These discrepancies stem from varying orbital altitudes, sensor designs, swath widths, and revisit schedules. Understanding these connections is essential for selecting appropriate datasets for GIS analysis.
Orbit and platform
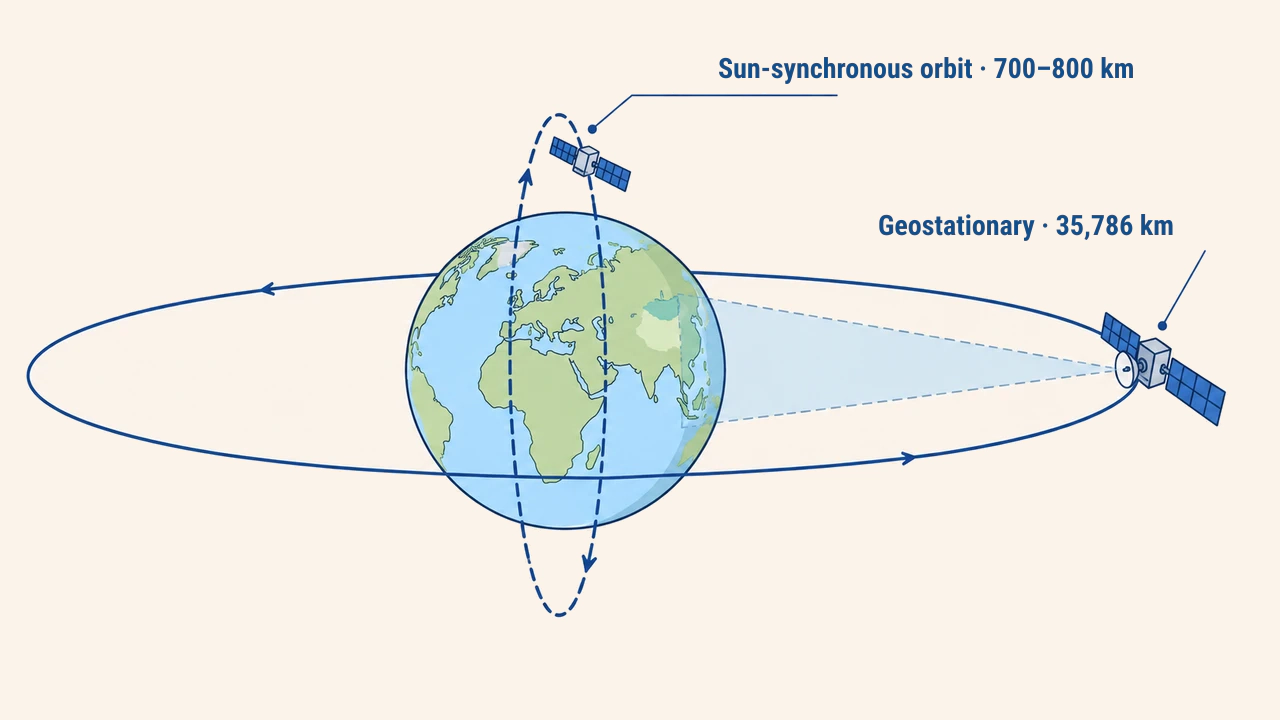
Earth observation satellites operate predominantly in two orbital regimes. A geostationary orbit sits roughly 35,786 km directly above the equator. The satellite matches the Earth's rotational speed, constantly viewing the same hemisphere. Weather satellites image continental weather patterns from this vantage point every few minutes, though pixel dimensions span several kilometers.
A sun-synchronous polar orbit operates several hundred kilometers above the surface. Satellites pass near the poles, crossing the equator at identical local solar times on each pass. This ensures consistent sun angles and comparable illumination across multi-temporal acquisitions. Landsat 9 orbits at an altitude of 705 km (NASA), while Copernicus Sentinel-2 flies at roughly 786 km (ESA).
How sensors capture imagery
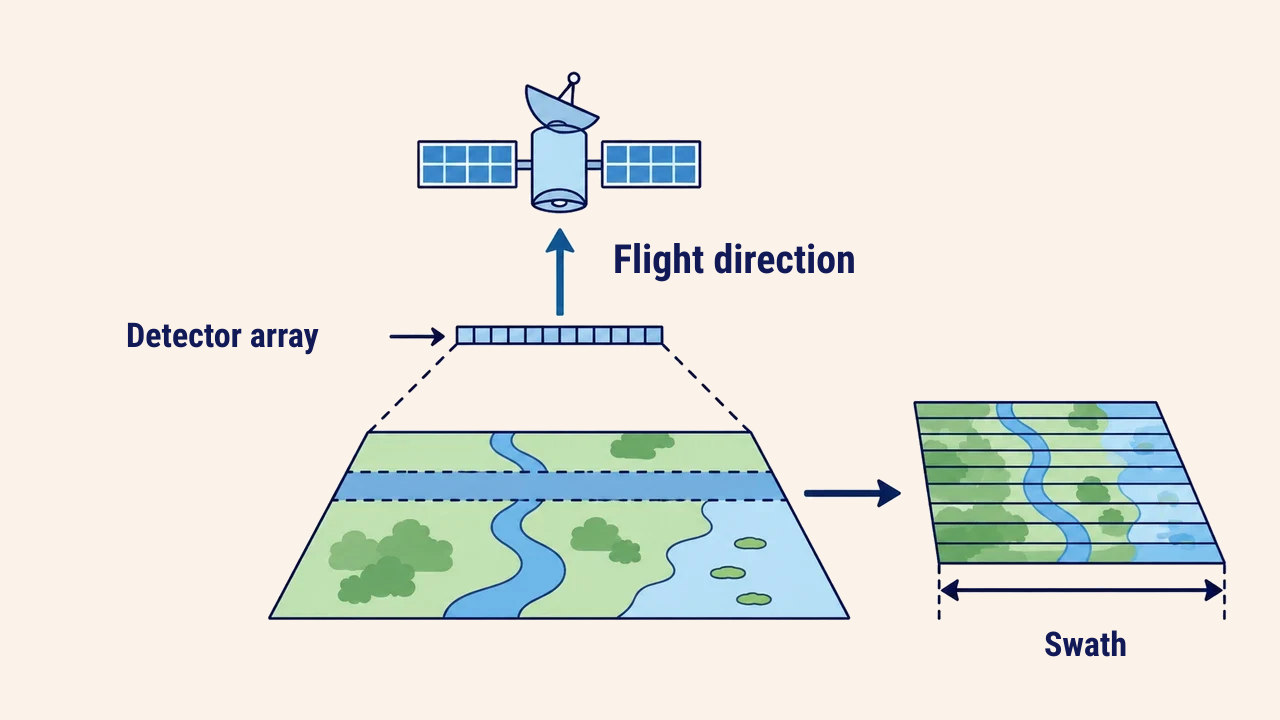
Most contemporary optical instruments employ pushbroom scanning arrays. Thousands of individual detectors are aligned perpendicular to the satellite's orbital flight direction, capturing an entire ground line simultaneously. As the platform advances forward, sequential lines accumulate into a seamless image strip. Older mechanical scanners used oscillating mirrors directing light toward a single detector.
The ground width recorded in a single pass is termed the swath. Landsat 8–9 features a 185-km swath width, whereas Sentinel-2 spans 290 km. Broader coverage maps regions more quickly, yet swath width and pixel resolution are balanced by engineering trade-offs. For example, the MODIS instruments on Terra and Aqua boast a 2,330-km swath, imaging the globe nearly daily at pixel sizes ranging from 250 meters to 1 kilometer. While too coarse for farm parcel mapping, MODIS excels at tracking regional snow cover or continental wildfires.
Revisit time
Revisit time denotes the elapsed duration before a satellite re-occupies identical orbital ground tracks to image the same location again. A single Landsat satellite returns every 16 days; operating Landsat 8 and 9 together shortens this revisit interval to 8 days. The Copernicus Sentinel-2 mission (as of 2026) pairs two identical satellites offset by 180°, delivering a 5-day revisit at the equator and even shorter intervals at higher latitudes.
In operational practice, the number of usable scenes is lower than nominal revisit rates due to cloud cover. For instance, agricultural crop monitoring plans must anticipate losing acquisitions during overcast weather.
| Metric | Landsat 8–9 (OLI) | Sentinel-2 (MSI) |
|---|---|---|
| Orbit altitude | 705 km | 786 km |
| Swath width | 185 km | 290 km |
| Minimum pixel size | 15 m (panchromatic), 30 m | 10 m |
| Revisit interval | 8 days (two satellites combined) | 5 days (at equator, two satellites) |
Data processing levels
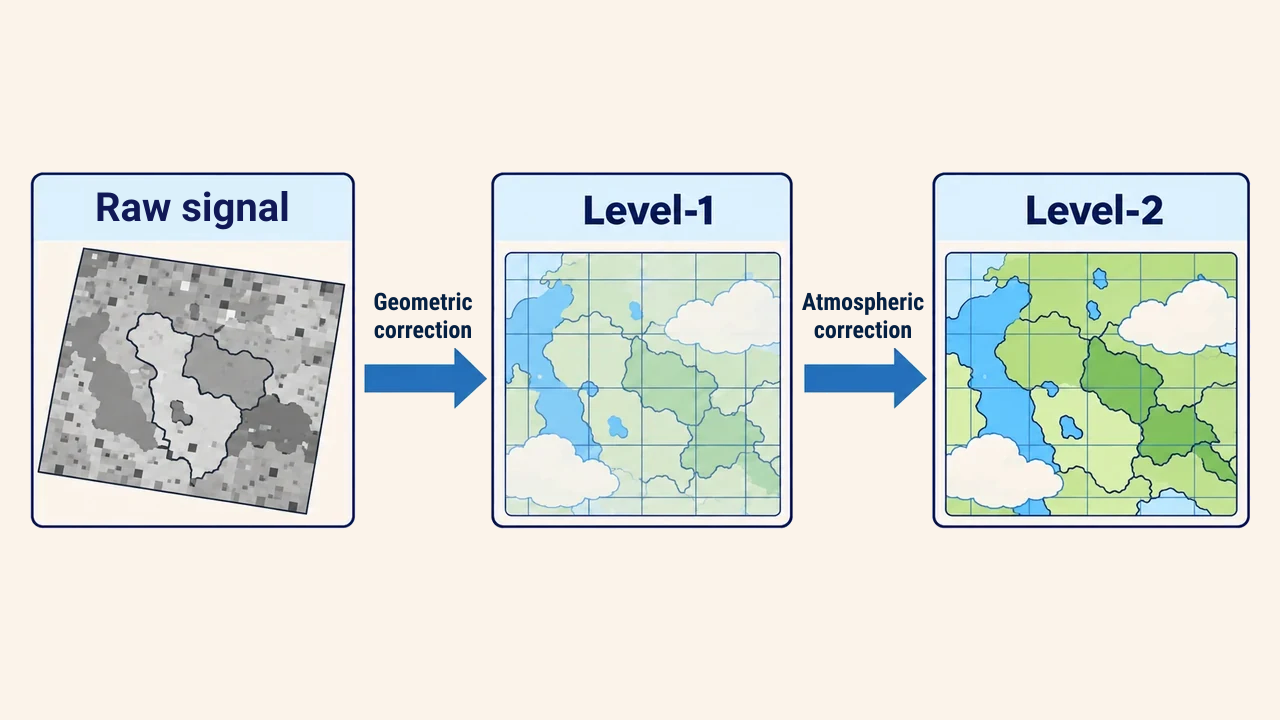
Raw digital counts straight from satellite detectors cannot be analyzed directly. Data distributors apply standardized processing pipelines. Level-1 products provide orthorectified, georeferenced rasters where pixel values represent top-of-atmosphere (TOA) radiance or reflectance. Level-2 products correct for atmospheric scattering and absorption, converting values to true surface reflectance. These correspond to L1C and L2A in Sentinel-2, and Collection 2 Level-1 and Level-2 in Landsat.
Calculating vegetation indices or comparing multi-temporal series generally requires Level-2 products. If customized atmospheric modeling is needed, analysts start with Level-1 data. Processing levels and collection versions must be recorded in project metadata.
Conclusion
Image properties stem directly from platform altitude, orbital trajectory, and sensor design. Geostationary satellites offer frequent updates at coarse resolutions, while polar-orbiting missions like Landsat and Sentinel-2 deliver fine detail at moderate revisit frequencies.
When selecting imagery, analysts evaluate pixel dimensions, swath width, revisit schedules, and processing levels simultaneously. Aligning these parameters with project objectives ensures dependable spatial analysis.