What is web GIS?
Introduction
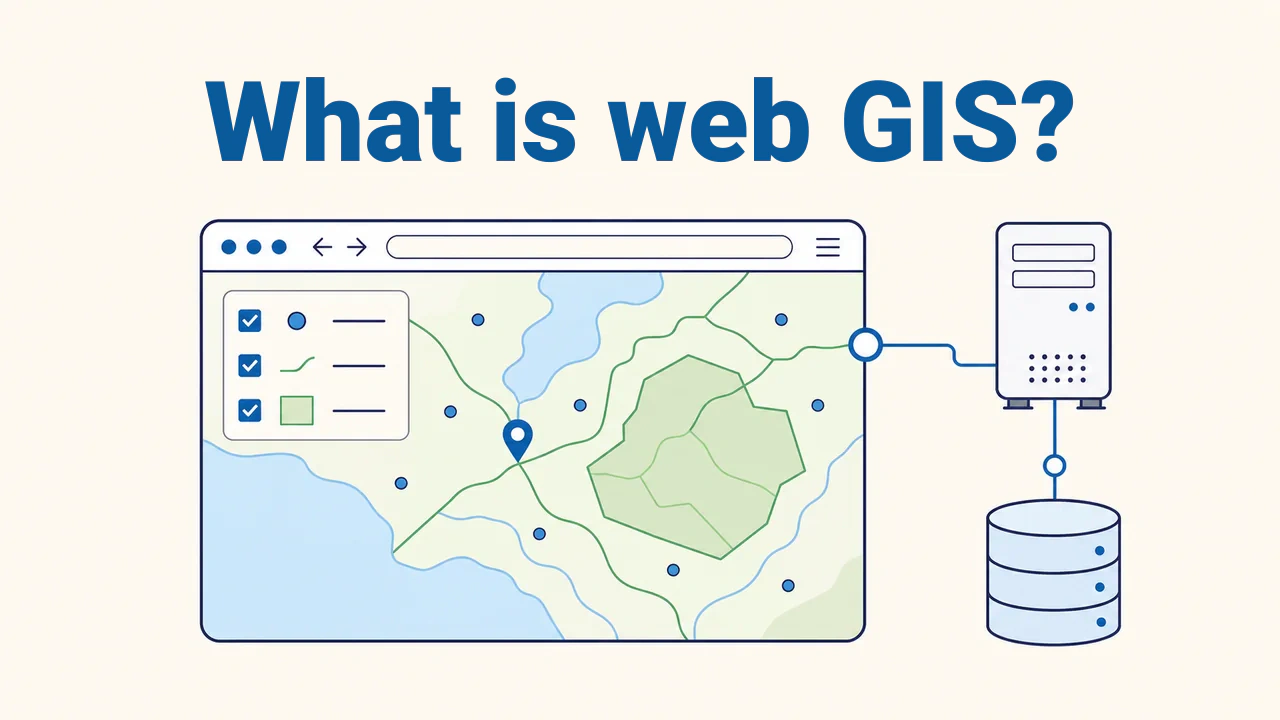
Web GIS is a system that delivers geographic information system data and capabilities through web technologies. It operates across the internet or within an organization's internal network. Users can view maps in a browser, toggle layers, inspect attributes, or query areas.
A web map serves to display information; web GIS organizes search, spatial analysis, or data editing depending on the task. For example, viewing a pipe on a map versus logging a defect represent different capabilities. Mobile and desktop apps can also consume these services.
Core system components
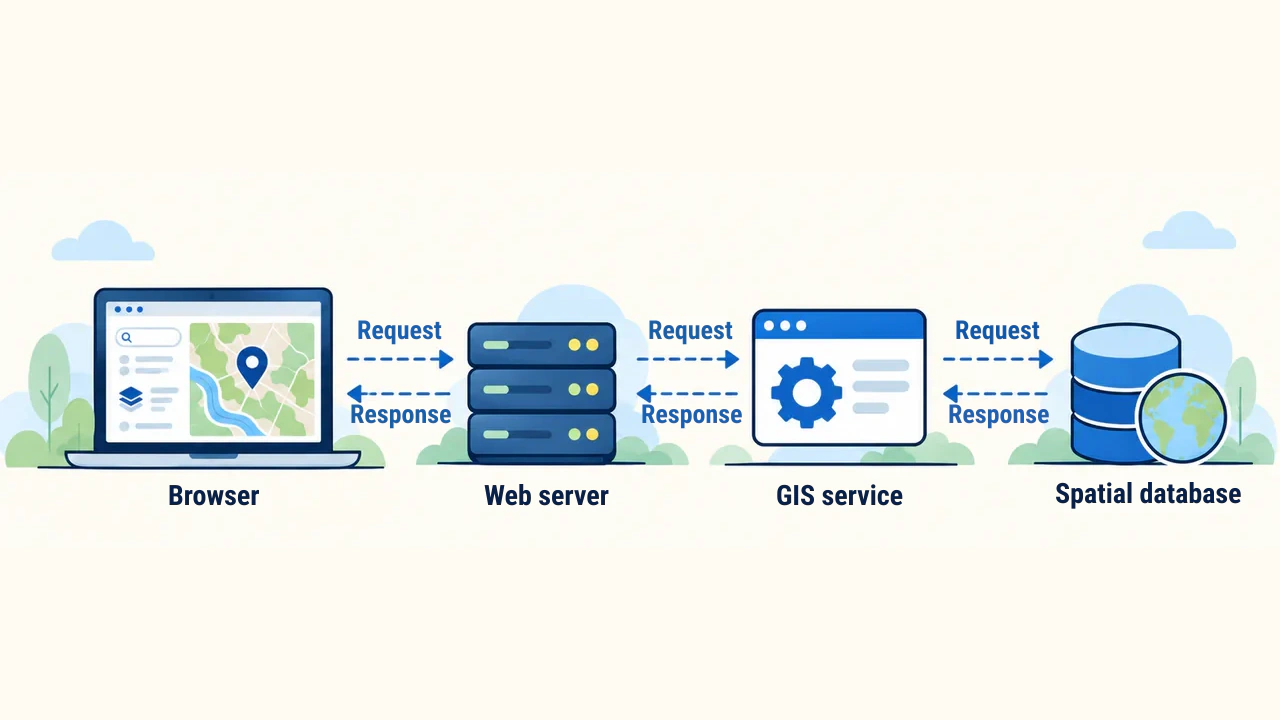
A common architecture includes a client app, web server, GIS service, and data source. The browser renders the map and accepts user interactions, assisted by a mapping library like Leaflet. The web server delivers page files. The GIS service prepares map images or spatial features from layers; GeoServer provides such services.
The data source can be static files or a spatial database. For instance, the PostGIS extension for PostgreSQL manages geometries and attributes. Components need not reside on separate servers. A small map can work with static files, while a large system relies on a database and multiple services. The diagram below illustrates this architecture.
Request and response
When panning or zooming a map, the browser sends a request to the server if required data is not yet loaded. The HTTP protocol (Hypertext Transfer Protocol) defines communication rules between browser and server. The server returns map images or spatial data with geometry and attributes.
A tile is a map section partitioned along a grid for a specific zoom level. A raster tile carries an image, while a vector tile carries geometry and attributes. Tiles can come from pre-rendered caches or be generated on demand. A cache stores previously received responses for reuse. The browser typically requests the visible area and its immediate surroundings.
Web Map Service (WMS) is an open standard for requesting map images; its role is defined in the OGC standard. An application programming interface (API) enables software systems to exchange data. The OGC API — Features standard specifies methods for retrieving feature collections or individual features.
Difference between images and features
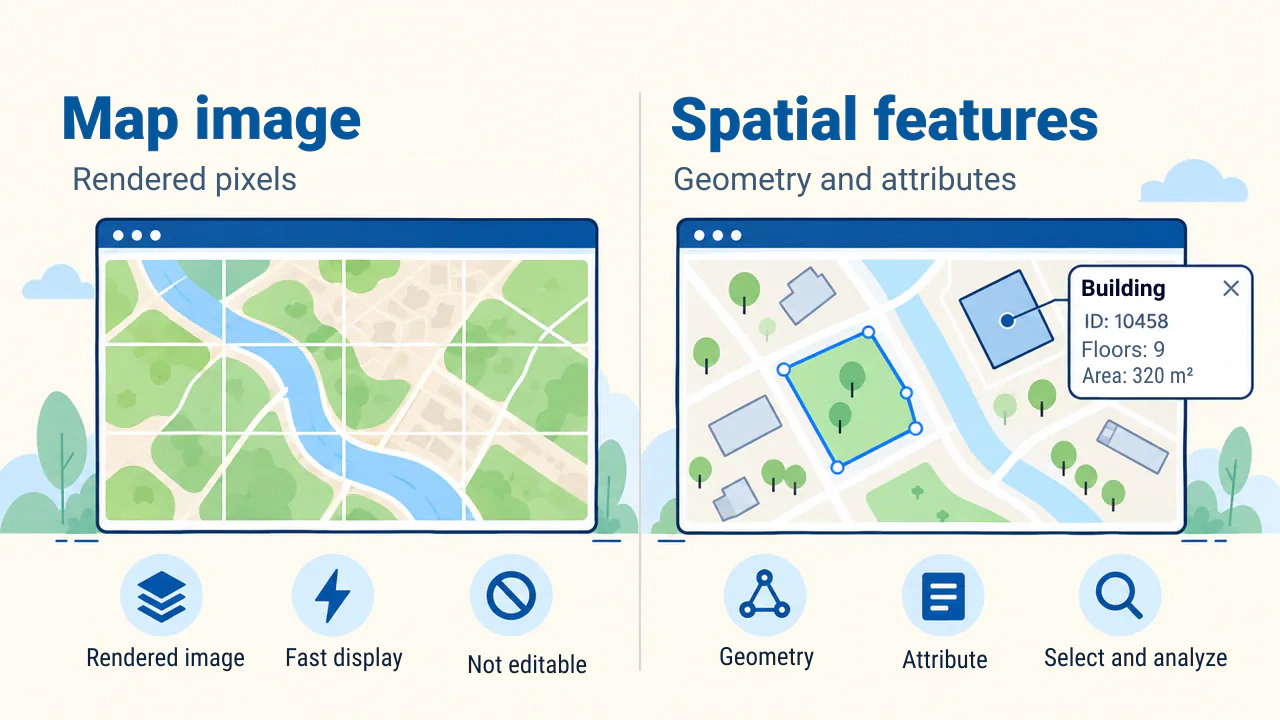
A map image consists of pre-rendered pixels: buildings or roads do not arrive in the browser as individual geometries. However, if supported and configured as queryable, feature attributes at a clicked location can be retrieved via WMS GetFeatureInfo. This condition is explained in the GeoServer documentation.
In a feature response, points, lines, or polygons in the vector model and their attributes are transmitted. The application can select features and alter symbology. Saving edits to a database requires a separate service and permissions.
Vector tiles transmit geometry in tiles for client-side styling. For rendering efficiency, geometry may be clipped or simplified; therefore, it should not be used as an authoritative editing source. This limitation is noted in the OpenLayers documentation.
Practical scenario
Consider a web GIS created for a municipal water network. Public users view streets closed for repairs. An authorized technician logs in, inspects pipe diameter and last maintenance date, and records a malfunction. The basemap can be delivered as raster or vector tiles, while operational layers are served as queryable features.
Testing ensures public users cannot access restricted attributes, and logged defects persist when reopening the page. Map performance and reliable data storage are evaluated independently.
Performance, accuracy, and security
Queries are limited to the required area and attributes; large responses are paginated. A spatial index helps find features quickly by location. Simplified geometry reduces payload size, but should not replace source data.
Web Mercator (EPSG:3857) is widely used for display, but computing planar distance and area within it introduces distortion. Accurate measurements require a region-appropriate coordinate reference system (CRS) or methods accounting for the Earth's shape. Formulas are in PROJ documentation.
Hiding a private layer URL is not security. The server validates permissions and inputs on every request. Edits are logged, and non-public attributes excluded.
Preparation and publishing stages
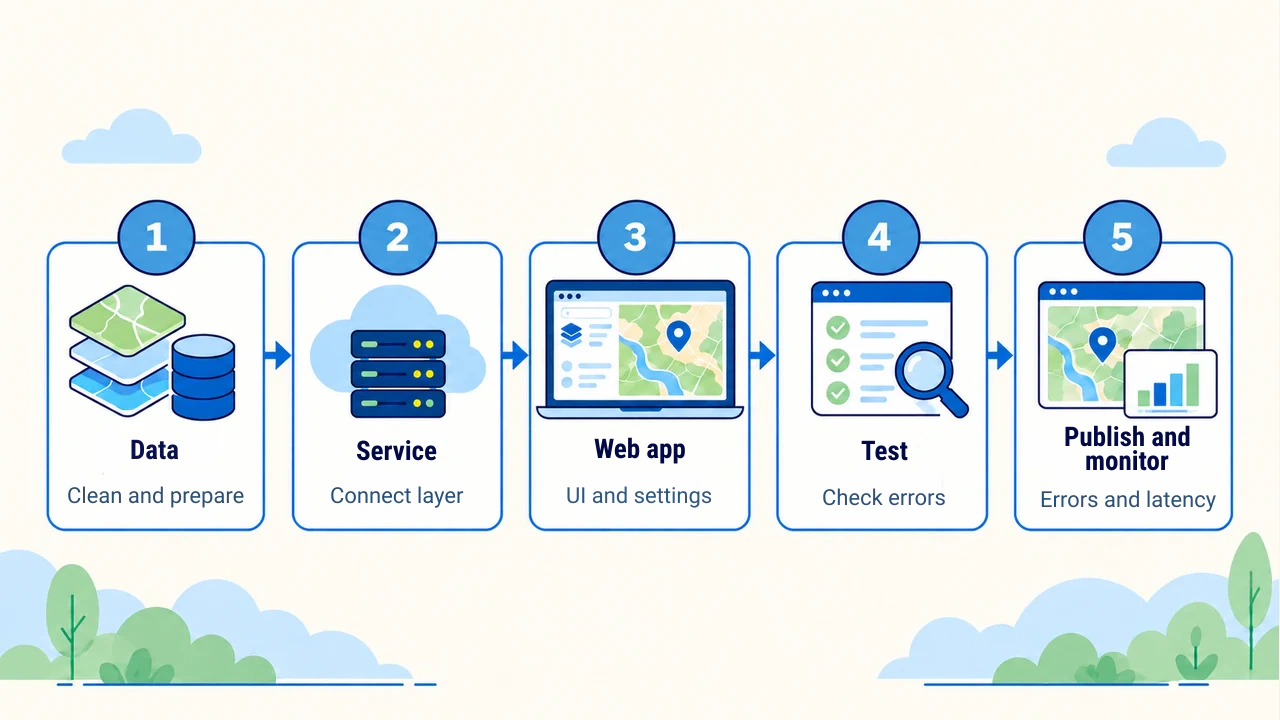
The process begins with cleaned data and metadata. Once services and interfaces are configured, coordinate reference systems, layer names, legends, empty responses, server errors, and permissions are tested. Label legibility on mobile screens and loading over slow networks are verified separately.
After publishing, errors, response times, and service availability are monitored. When data updates, the corresponding tile cache is refreshed to ensure outdated content does not remain on the map.
Technical sources verified on October 14, 2026.
Conclusion
The architecture of a web GIS is selected based on project needs: simple display, feature queries, and saving edits require different services. A reliable project begins with choosing the right data transmission method, accounting for measurement limits, and verifying user permissions. Post-launch monitoring helps preserve map currency and service stability.