Web map libraries: Leaflet, OpenLayers, MapLibre
Introduction
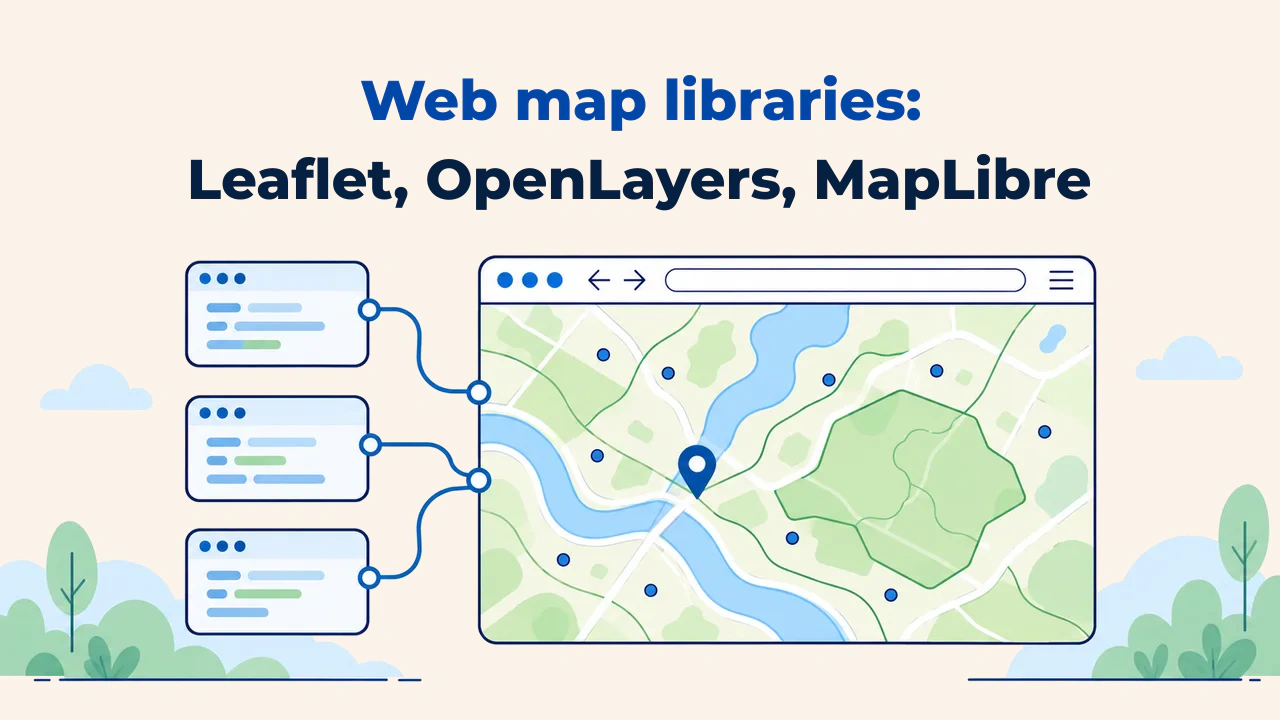
A web mapping library is a client-side JavaScript engine that renders and manages interactive spatial maps inside web browsers. It fetches map tiles, manages layer hierarchies, handles pan and zoom interactions, and detects user selections across map features.
Within Web GIS architectures, this library governs the user presentation tier. No matter how robust the backend server infrastructure is, selecting an unsuitable client library leads to sluggish interactions, poor mobile usability, or architectural bottlenecks. Among open-source alternatives, Leaflet, OpenLayers, and MapLibre GL JS represent three dominant options.
What does a web mapping library do?
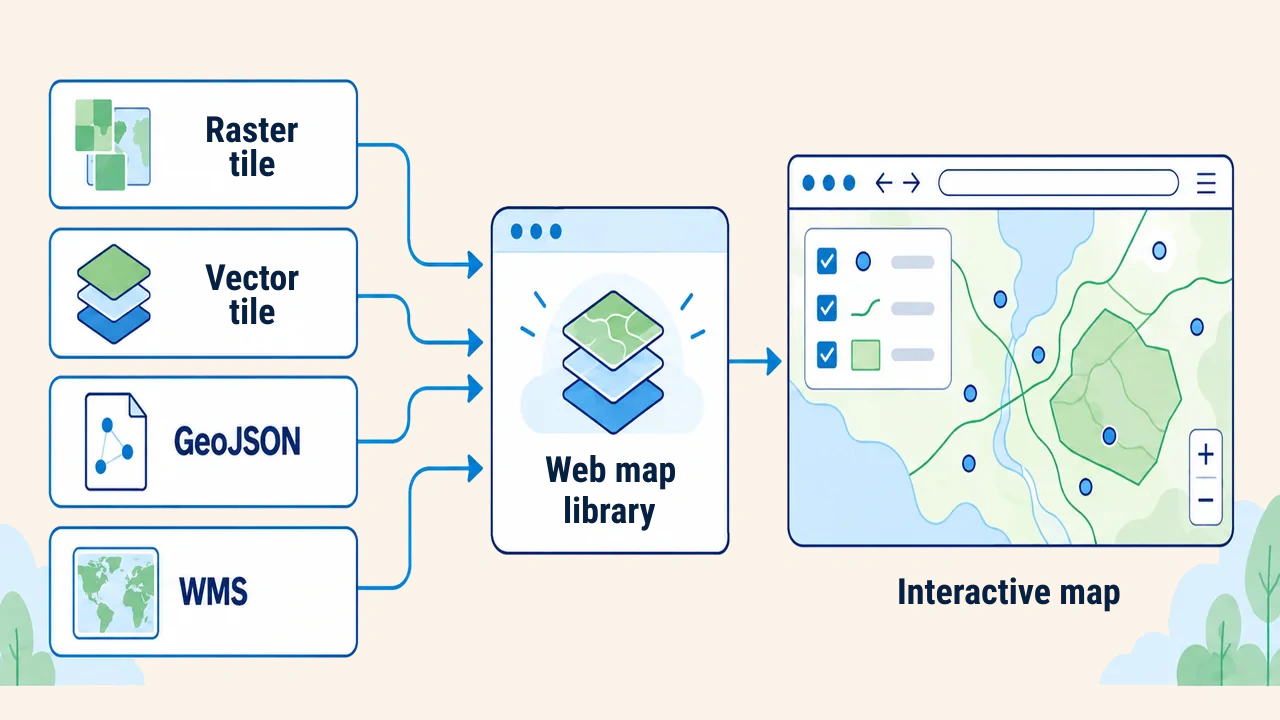
The mapping library does not store data locally. It ingests data from disparate endpoints—raster tiles, vector tiles, GeoJSON files, or Web Map Service (WMS) image layers—translates geographic coordinates into screen pixel coordinates, and draws them to the screen. It simultaneously manages events: mouse clicks, pointer movements, touch gestures, and zoom adjustments.
Most web maps operate within the Web Mercator (EPSG:3857) projection. Raw geographic data is typically structured in WGS 84 latitude-longitude coordinates, which the library projects dynamically onto the viewport. Therefore, the Coordinate Reference System (CRS) of input layers must match the library's projection expectations.
Overview of the three libraries
Leaflet is a lightweight mapping library with a clean, focused API. According to its official website (as of October 2026), the core minified JavaScript bundle weighs approximately 42 KB gzipped. It focuses on raster tile basemaps and straightforward vector overlays; specialized capabilities are added via plugins. Its shallow learning curve makes it popular for simple maps, prototypes, and educational training.
OpenLayers is a feature-rich geospatial library. OpenLayers natively supports open OGC protocols: WMS, Web Map Tile Service (WMTS), and Web Feature Service (WFS), alongside vector tiles and arbitrary coordinate systems. It is preferred for enterprise portals requiring local non-Mercator projections or advanced vector feature editing, though it requires more initial ramp-up time.
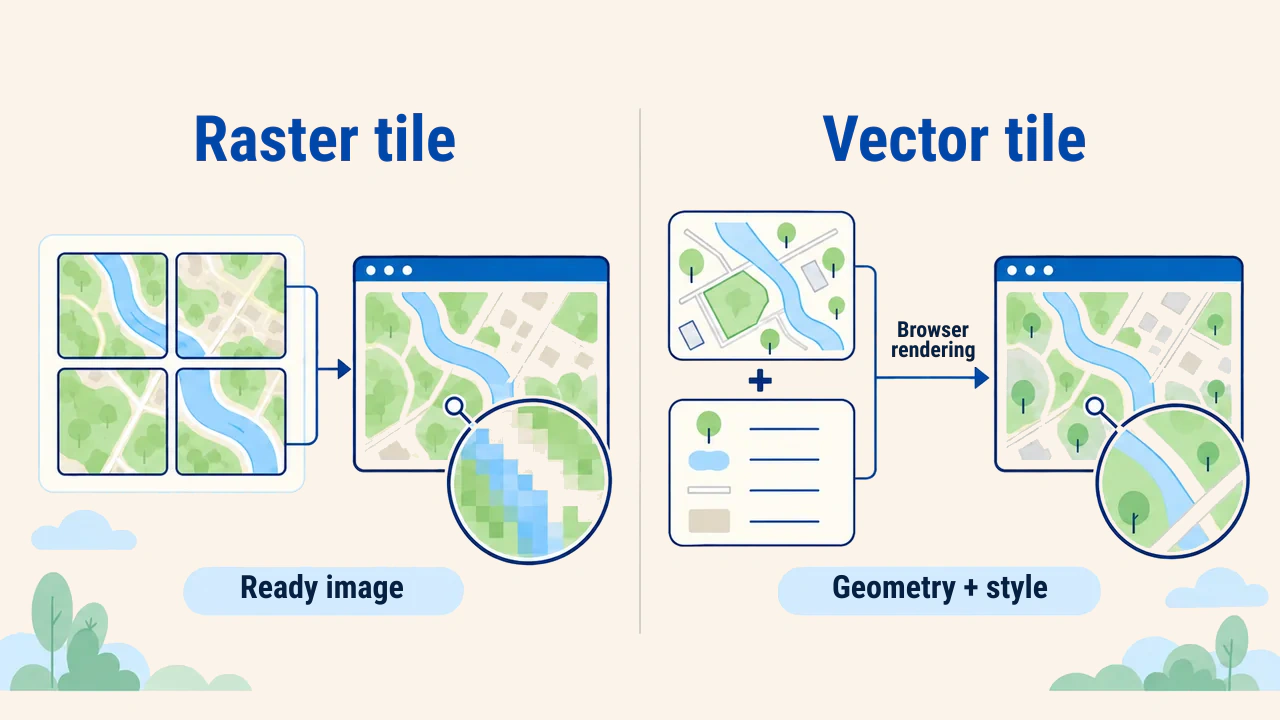
MapLibre GL JS is a GPU-accelerated client that renders vector tiles in the browser using WebGL. It was created in late 2020 as an open-source community fork of Mapbox GL JS 1.x following a licensing change. Map styling is declared in JSON stylesheets, delivering smooth 60 FPS transitions, continuous rotation, and 3D terrain pitch. The MapLibre documentation outlines style specifications and JavaScript APIs thoroughly.
Comparison
| Criterion | Leaflet | OpenLayers | MapLibre GL JS |
|---|---|---|---|
| Rendering engine | DOM, SVG, Canvas | Canvas, WebGL | WebGL |
| Key strength | Simplicity, plugin ecosystem | OGC standards, projection support | Vector tiles, dynamic styling, 3D |
| Projections | Primarily Web Mercator | Extensive projection support via proj4 | Web Mercator and globe |
| License | BSD-2 | BSD-2 | BSD-3 |
| Learning curve | Gentle | Moderate to steep | Moderate |
Rendering mechanisms govern rendering performance: DOM and SVG create individual document tags for every feature, Canvas draws entire layers into a bitmap buffer, and WebGL offloads rendering computations to the GPU. When rendering tens of thousands of vertices, Canvas and WebGL outperform SVG dramatically.
First map and common pitfalls
In Leaflet, centering an interactive map over Tashkent requires only minimal code:
const map = L.map('map').setView([41.31, 69.28], 12);
L.tileLayer('https://tile.openstreetmap.org/{z}/{x}/{y}.png', {
  maxZoom: 19,
  attribution: '© OpenStreetMap contributors'
}).addTo(map);
L.marker([41.31, 69.28]).addTo(map).bindPopup('Tashkent');
Leaflet requires coordinates in [latitude, longitude] order. Conversely, GeoJSON standards and MapLibre require [longitude, latitude] ordering. Reversing this order places markers near the Barents Sea rather than Tashkent—a classic beginner error. Additionally, OpenStreetMap tile usage policies prohibit high-volume commercial production traffic on community tile servers, requiring production apps to deploy dedicated tile infrastructure.
Selection criteria
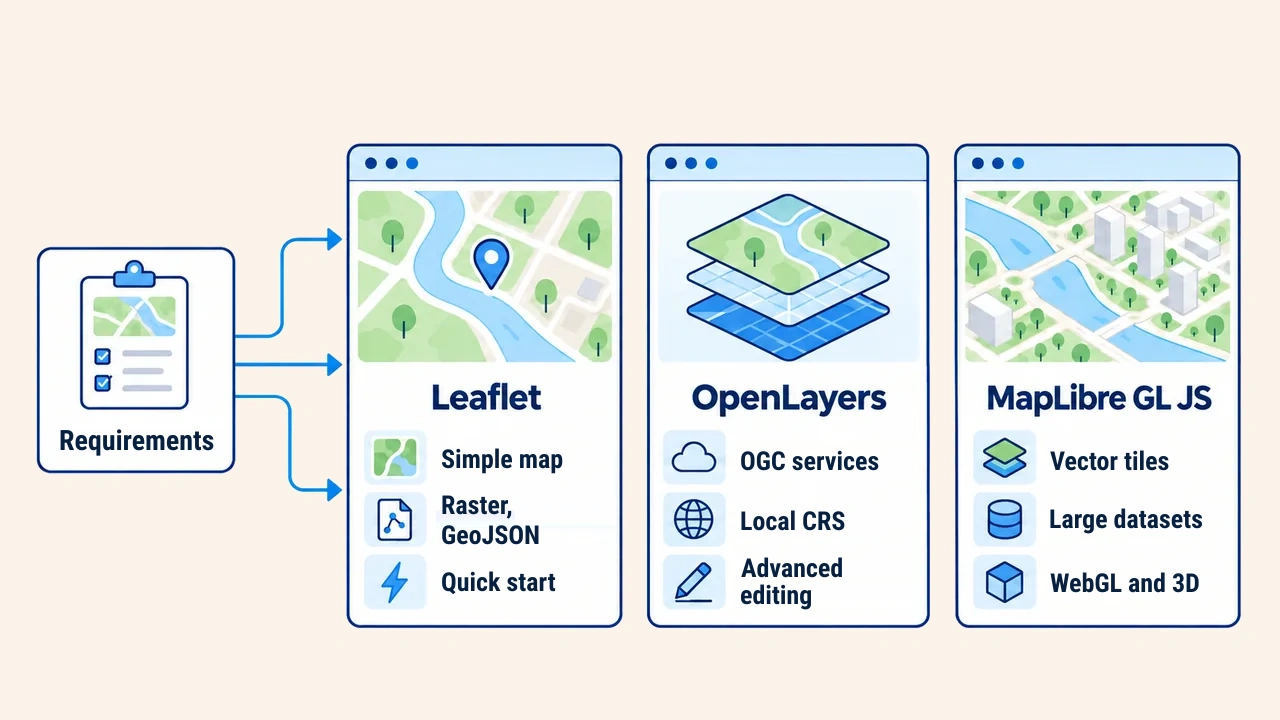
Technology choices depend on project demands. For simple point locators, thematic basemaps, or single WMS overlays, Leaflet is sufficient. When integrating OGC services (WMS, WMTS, WFS), local projected coordinates, or geometric digitization, OpenLayers is the standard. For rendering dense vector datasets, dynamic client-side restyling, and smooth 3D interactions, select MapLibre GL JS.
Consider software ecosystems as well. Leaflet offers rich clustering and drawing plugins. MapLibre pairs seamlessly with modern tile servers like Martin and single-file PMTiles archives. Documentation completeness and release cadence are equally critical for long-term support.
Build a rapid prototype with representative datasets to evaluate rendering speeds, mobile gestures, and low-bandwidth resilience before locking in architecture. Migrating client libraries later requires refactoring significant frontend code; establish this decision early during project scoping.
Conclusion
Leaflet delivers compact simplicity, OpenLayers provides complete geospatial standard compliance, and MapLibre GL JS brings high-performance vector tile rendering and modern styling. There is no single universal library.
An optimal choice balances dataset structures, service protocols, client workloads, and team proficiencies validated through prototype testing.